What Can You Do With This Plugin?
COVID-19 Coronavirus – Viral Pandemic Prediction Tools Plugin for WordPress is a breaking edge pandemic modeling software, that will allow you to visualize using charts and tables with estimated data, the possible impact of pandemics, on society. You will be able to model the possible magnitude and severity of a pandemic (local or worldwide).
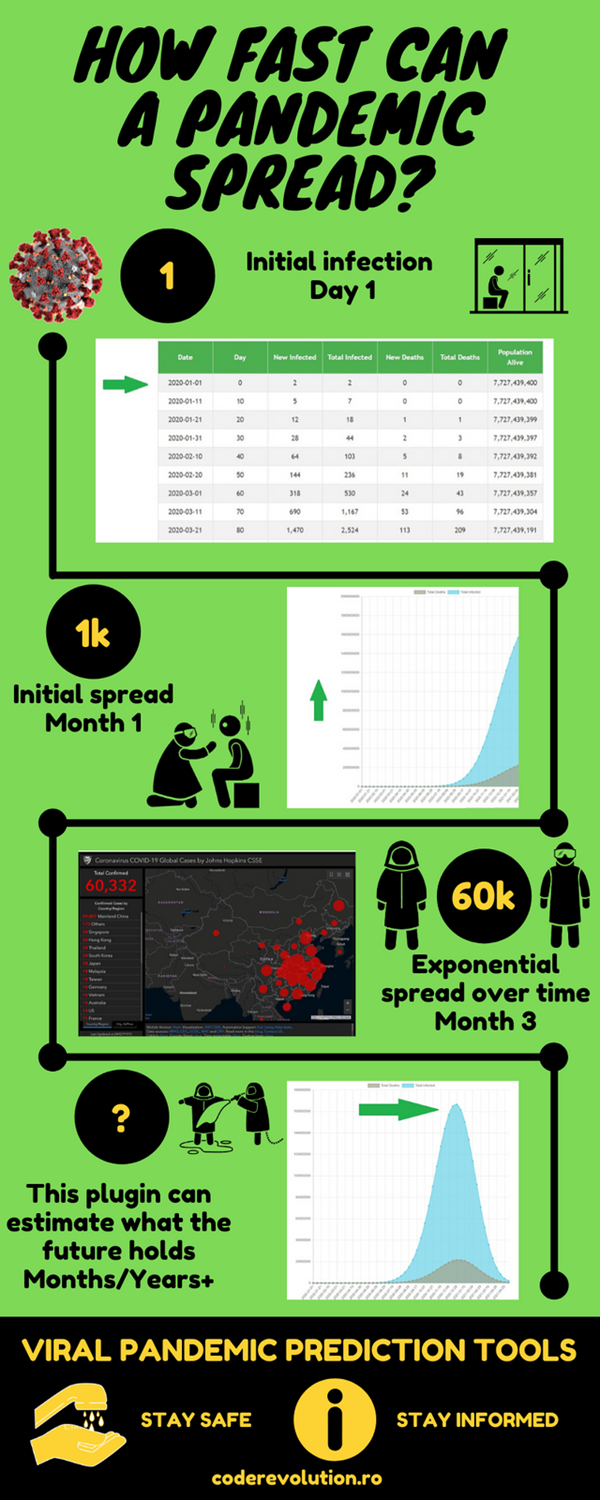
How fast can the COVID-19 Coronavirus spread?
Learn how the SARS-CoV-2 Coronavirus causing the COVID-19 disease (Wuhan China Outbreak or Pandemic) can spread rapidly with this Coronavirus Spreading Prediction Tool. Test your own scenarios or use real live data from CDC / WHO to update your own personal website that will contain a personalized Coronavirus Prediction Tool!
COVID-19 Coronavirus – Viral Pandemic Prediction Tools WordPress Plugin is a powerful tool to inform your website’s visitors about the impact of a global pandemic, which might be caused by the COVID-19 Coronavirus.
– You can embed tables and charts with the prediction of the evolution of the spreading of a global or regional pandemic. – It can also use iframes to automatically embed dashboards from WHO and Johns Hopkins, to track in real time the progress of the outbreak. The goal is to achieve the following:
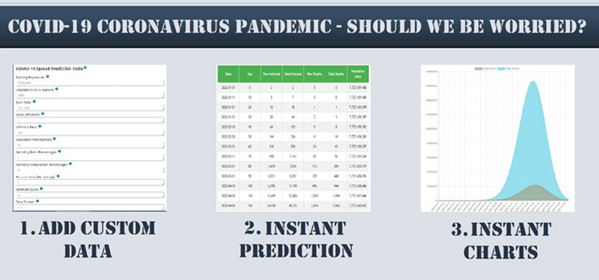
COVID-19 Coronavirus – Viral Pandemic Prediction Tools will automatically create prediction tables and charts
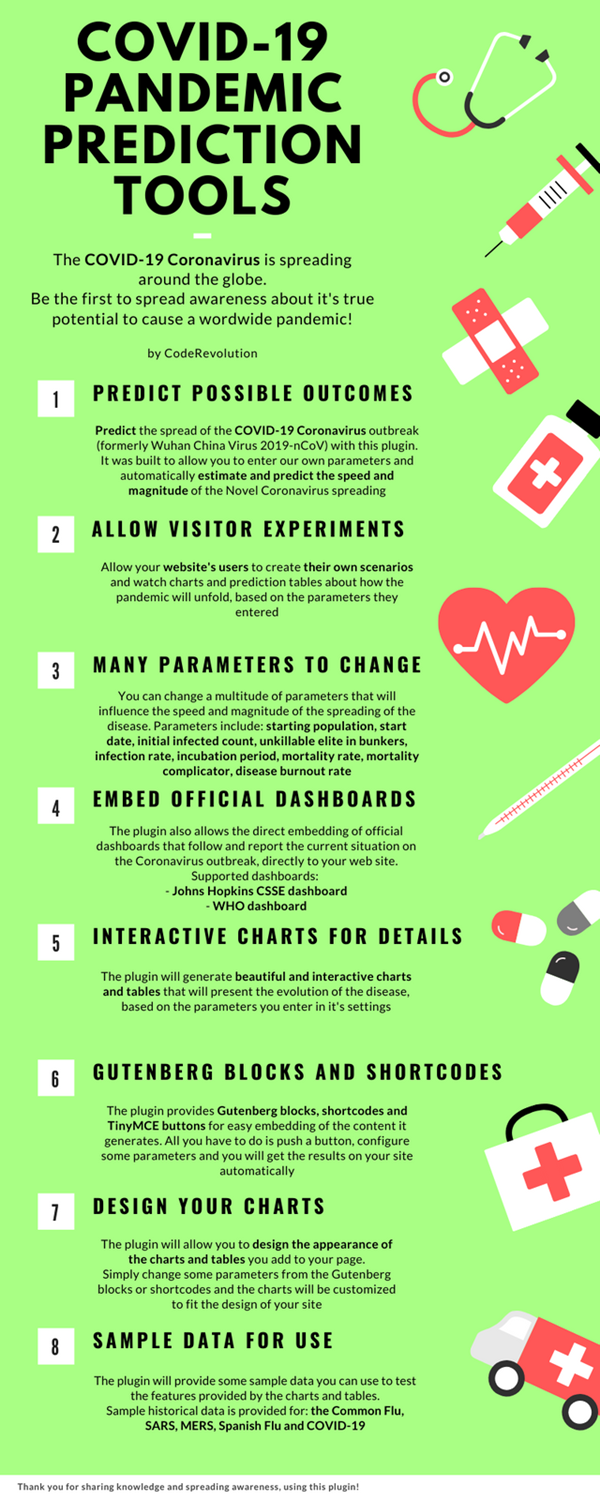
Predict possible outcomes for the a possible pandemic
Predict the spread of the COVID-19 Coronavirus outbreak (formerly Wuhan China Virus 2019-nCoV) with this plugin. It was built to allow you to enter our own parameters and automatically estimate and predict the speed and magnitude of the Novel Coronavirus spreading
Allow your visitors to experiment with data and results
Allow your website’s users to create their own scenarios and watch charts and prediction tables about how the pandemic will unfold, based on the parameters they entered
Many parameters to change
You can change a multitude of parameters that will influence the speed and magnitude of the spreading of the disease. Parameters include: starting population, start date, initial infected count, unkillable elite in bunkers, infection rate, incubation period, mortality rate, mortality complicator, disease burnout rate
Embed Official Dashboards to track the outbreak in real time
The plugin also allows the direct embedding of official dashboards that follow and report the current situation on the Coronavirus outbreak, directly to your web site.
Supported dashboards:
- Johns Hopkins CSSE dashboard
- WHO dashboard
Interactive charts for details
The plugin will generate beautiful and interactive charts and tables that will present the evolution of the disease, based on the parameters you enter in it’s settings
Gutenberg blocks and shortcodes
The plugin provides Gutenberg blocks, shortcodes and TinyMCE buttons for easy embedding of the content it generates. All you have to do is push a button, configure some parameters and you will get the results on your site automatically
Design your charts
The plugin will allow you to design the appearance of the charts and tables you add to your page. Simply change some parameters from the Gutenberg blocks or shortcodes and the charts will be customized to fit the design of your site
Sample data for use
The plugin will provide some sample data you can use to test the features provided by the charts and tables. Sample historical data is provided for: the Common Flu, SARS, MERS, Spanish Flu and estimated data for the current SARS-CoV-2, which causes COVID-19.
Parameter Explanations
- Starting Population – The starting population for the outbreak/pandemic. This can be the population of the globe, your country, city or even university.
- Elite in Bunkers and Immune – This is the number of people that will never get sick – because they are naturally immune or they are hiding in bunkers or are fully isolated from the infected population.
- Start Date – This is the date when the first patient is infected.
- Initial Infections – The number of initial infections that occurred on the start date.
- Infection Rate (R0) – The number of additional people that are infected by a single patient that already has the virus (during the incubation period).
- Incubation Period (Days) – The average time from becoming infected to showing thee first symptoms.
- Mortality Rate (Percentage) – How many people die of the virus as a percentage of those who become infected (an average death rate).
- Mortality Complicator (Percentage) – This will increase the ‘Mortality Rate’ where there is a large number of new infected in a short period of time and is based on the increasing likelihood of mortality as more of the health care system becomes overwhelmed (more and more severe and critical cases that need medical help to survive, in a short period of time).
- Virus Burnout Rate (Percentage) – This represents a reduction of the ‘Infection Rate’ over time – it represents the increased quarantine measures, progress with discovering a cure or vaccine and fewer healthy hosts to infect.
Testing this plugin
- You can test the plugin’s functionality using the ‘‘Plugin’s Front End Demo’’. Here you can try the plugin’s features on a fully configured demo site – you can check graphs and results.
- You can test the plugin’s functionality using the ‘‘Plugin’s Back End Demo’’. Here you can try the plugin’s full functionality. Note that the generated testing blog will be deleted automatically after 24 hours.
The online fancy text generator will make your words stand out when posting on social media.
Dear user, you must first login to your account to write your comment.
Please click here to Log in
Access Permission Error
You do not have access to this product!
Dear User!
To download this file(s) you need to purchase this product or subscribe to one of our VIP plans.
Files Password : webdevdl.ir
Note
Download speed is limited, for download with higher speed (2X) please register on the site and for download with MAXIMUM speed please join to our VIP plans.


